Bitfarms Reports Fourth Quarter 2024 Results
- Revenue of
- Gross mining margin of 47%, down from 57% from Q4 2023 -
- 18.6 EHuM up 186% from Q4 2023-
- Current efficiency of 19w/TH a 45% improvement from Q4 2023-
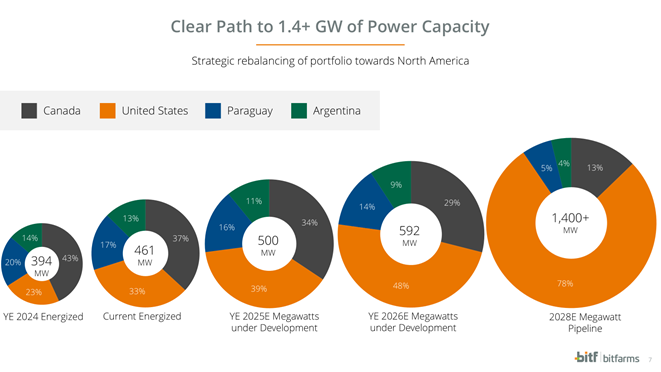
-Total energy pipeline of ~1.4 GW, ~80% based in the
-Completed acquisition of
This news release constitutes a “designated news release” for the purposes of the Company’s second amended and restated prospectus supplement dated
CEO
“Just last week, we closed both the transformative acquisition of
“While we remain confident in the significant upside potential of our BTC mining operations and continue to maximize the value of our assets, our revenue diversification strategy—both in the
SVP of Mining Operations
CFO
Anticipated Megawatt Growth
Mining Operations
- Current hashrate of 18.6 EHuM, up from 6.5 EHuM in Q4 2023
- Current efficiency of 19 w/TH, a 45% improvement from Q4 2023
Recent Strategic Developments
- Completed previously announced acquisition of
Stronghold Digital Mining, Inc. - Completed previously announced sale of 200 MW data center in Yguazu,
Paraguay to HIVE Digital Technologies - Secured two strategic partners, ASG and World Wide Technology, to advance HPC/AI business
- Strengthened Management team with two new strategic hires,
James Bond , SVP of HPC/AI, andCraig Hibbard , SVP of Infrastructure - Initiated Bitcoin One program following the success of Synthetic HODL program in 2024, which achieved a 135% return since the program's inception in Q4 2023 through
December 31, 2024 .
Q4 2024 Financial Highlights
- Total revenue of
$56 million , up 21% Y/Y - Gross mining margin of 47%, down from 57% in Q4 2023
- General and administrative expenses of
$18 million , compared to$13 million in Q4 2023 - Operating loss of
$16 million compared to an operating loss of$13 million in Q4 2023 - Net income of
$15 million , or$0.03 per basic and diluted share compared to a net loss of$62 million or$0.21 per basic and diluted share in Q4 2023 - Adjusted EBITDA* of
$14 million , or 25% of revenue, down from$16 million or 35% of revenue in Q4 2023 - The Company earned 654 BTC at an average direct cost of production per BTC* of
$40,800 - Total cash cost of production per BTC* was
$60,800 in Q4 2024
Liquidity**
As of
Q4 2024 and Recent Financing Activities
- Sold 502 BTC at an average price of
$81,400 for total proceeds of$41 million in Q4 2024 and sold 117 of the 414 BTC earned during January andFebruary 2025 , generating total proceeds of$11 million . A portion of the funds was used to pay capital expenditures to support the Company’s growth and efficiency improvement objectives. - As of
March 26, 2025 , the Company held 1,093 Bitcoin. - Raised
$50 million in net proceeds during Q4 2024 bringing the total net proceeds to$314 million throughMarch 26, 2025 under the Company's 2024 at-the-market equity offering program.
| Quarterly Operating Performance | |||
| Q4 2024 | Q3 2024 | Q4 2023 | |
| Total BTC earned | 654 | 703 | 1,236 |
| Average Watts/Average TH efficiency*** | 22 | 23 | 35 |
| BTC sold | 502 | 461 | 1,135 |
| As of | As of | As of | |
| 2024 | 2024 | 2023 | |
| Operating EH/s | 12.8 | 11.3 | 6.5 |
| Operating capacity (MW) | 394 | 310 | 240 |
| Quarterly Average Revenue**** and Cost of Production per BTC* | ||||||||||
| Q4 2024 | Q3 2024 | Q2 2024 | Q1 2024 | Q4 2023 | ||||||
| Avg. Rev****/BTC | ||||||||||
| Direct Cost*/BTC | ||||||||||
| Total Cash Cost*/BTC | ||||||||||
* Gross mining profit, gross mining margin, EBITDA, EBITDA margin, Adjusted EBITDA, Adjusted EBITDA margin, Direct Cost per BTC and Total Cash Cost per BTC are non-IFRS financial measures or ratios and should be read in conjunction with, and should not be viewed as alternatives to or replacements of measures of operating results and liquidity presented in accordance with IFRS. Readers are referred to the reconciliations of non-IFRS measures included in the Company’s MD&A and at the end of this press release.
** Liquidity represents cash and balance of unrestricted digital assets.
*** Average watts represent the energy consumption of miners.
**** Average revenue per BTC is for mining operations only and excludes Volta revenue.
Conference Call
Management will host a conference call today at
The live webcast and a webcast replay of the conference call can be accessed here. To access the call by telephone, register here to receive dial-in numbers and a unique PIN to join the call.
Non-IFRS Measures*
As a Canadian company,
The Company uses Adjusted EBITDA to measure its operating activities' financial performance and cash generating capability.
About
Founded in 2017,
To learn more about Bitfarms’ events, developments, and online communities:
www.bitfarms.com
https://www.facebook.com/bitfarms/
http://x.com/Bitfarms_io
https://www.instagram.com/bitfarms/
https://www.linkedin.com/company/bitfarms/
Glossary of Terms
- BTC BTC/day = Bitcoin or Bitcoin per day
- EHuM = Exahash Under Management, which includes Bitfarms’ proprietary hashrate and hashrate being hosted by
Bitfarms for third-party hosting clients - EH or EH/s = Exahash or exahash per second
- MW or MWh = Megawatts or megawatt hour
- w/TH = Watts/Terahash efficiency (includes cost of powering supplementary equipment)
Q/Q = Quarter over Quarter- Y/Y = Year over Year
- Synthetic HODL™ = the use of instruments that create Bitcoin equivalent exposure
- HPC/AI = High Performance Computing / Artificial Intelligence
Forward-Looking Statements
This news release contains certain “forward-looking information” and “forward-looking statements” (collectively, “forward-looking information”) that are based on expectations, estimates and projections as at the date of this news release and are covered by safe harbors under Canadian and
Any statements that involve discussions with respect to predictions, expectations, beliefs, plans, projections, objectives, assumptions, future events or performance (often but not always using phrases such as “expects”, or “does not expect”, “is expected”, “anticipates” or “does not anticipate”, “plans”, “budget”, “scheduled”, “forecasts”, “estimates”, “prospects”, “believes” or “intends” or variations of such words and phrases or stating that certain actions, events or results “may” or “could”, “would”, “might” or “will” be taken to occur or be achieved) are not statements of historical fact and may be forward-looking information.
This forward-looking information is based on assumptions and estimates of management of
Investor Relations Contacts:
SVP, Head of IR & Corp. Comms.
+1 786-671-5638
[email protected]
Media Contacts:
Director, Communications
[email protected]
& Operational Results | ||||||||||||||||
| Three months ended | Year ended | |||||||||||||||
| (U.S.$ in thousands except where indicated) | 2024 | 2023 | $ Change | % Change | 2024 | 2023 | $ Change | % Change | ||||||||
| Revenues | 56,163 | 46,241 | 9,922 | 21 | % | 192,881 | 146,366 | 46,515 | 32 | % | ||||||
| Cost of revenues | (54,776 | ) | (44,484 | ) | (10,292 | ) | 23 | % | (225,240 | ) | (167,868 | ) | (57,372 | ) | 34 | % |
| Gross (loss) profit | 1,387 | 1,757 | (370 | ) | (21) | % | (32,359 | ) | (21,502 | ) | (10,857 | ) | 50 | % | ||
| Gross margin (1) | 2 | % | 4 | % | — | — | (17) | % | (15) | % | — | — | ||||
| Operating expenses | ||||||||||||||||
| General and administrative expenses | (18,042 | ) | (13,405 | ) | (4,637 | ) | 35 | % | (71,240 | ) | (39,292 | ) | (31,948 | ) | 81 | % |
| Reversal of revaluation loss on digital assets | — | 1,183 | (1,183 | ) | (100) | % | — | 2,695 | (2,695 | ) | (100) | % | ||||
| Gain (loss) on disposition of property, plant and equipment and deposits | 270 | (2 | ) | 272 | nm | (336 | ) | (1,778 | ) | 1,442 | (81) | % | ||||
| Impairment on short-term prepaid deposits, property, plant and equipment and assets held for sale | — | (2,270 | ) | 2,270 | 100 | % | (3,628 | ) | (12,252 | ) | 8,624 | (70) | % | |||
| Operating loss | (16,385 | ) | (12,737 | ) | (3,648 | ) | 29 | % | (107,563 | ) | (72,129 | ) | (35,434 | ) | 49 | % |
| Operating margin (1) | (29) | % | (28) | % | — | — | (56) | % | (49) | % | — | — | ||||
| Net financial income (expenses) | 21,843 | (49,686 | ) | 71,529 | 144 | % | 39,210 | (37,194 | ) | 76,404 | 205 | % | ||||
| Net (loss) income before income taxes | 5,458 | (62,423 | ) | 67,881 | 109 | % | (68,353 | ) | (109,323 | ) | 40,970 | (37) | % | |||
| Income tax recovery | 9,707 | 378 | 9,329 | nm | 14,290 | 401 | 13,889 | nm | ||||||||
| Net (loss) income | 15,165 | (62,045 | ) | 77,210 | 124 | % | (54,063 | ) | (108,922 | ) | 54,859 | (50) | % | |||
| Basic (loss) earnings per share (in | 0.03 | (0.21 | ) | — | — | (0.13 | ) | (0.42 | ) | — | — | |||||
| Diluted earnings (loss) per share (in | 0.03 | (0.21 | ) | — | — | (0.13 | ) | (0.42 | ) | — | — | |||||
| Change in revaluation surplus - digital assets, net of tax | 26,421 | 7,675 | 18,746 | 244 | % | 39,120 | 9,242 | 29,878 | 323 | % | ||||||
| Total comprehensive income (loss), net of tax | 41,586 | (54,370 | ) | 95,956 | 176 | % | (14,943 | ) | (99,680 | ) | 84,737 | (85 | %) | |||
| Gross Mining profit (2) | 25,786 | 25,454 | 332 | 1 | % | 94,469 | 70,277 | 24,192 | 34 | % | ||||||
| Gross Mining margin (2) | 47 | % | 57 | % | — | — | 50 | % | 50 | % | — | — | ||||
| EBITDA (2) | 29,752 | (40,542 | ) | 70,294 | 173 | % | 68,315 | (21,879 | ) | 90,194 | 412 | % | ||||
| EBITDA margin (2) | 53 | % | (88) | % | — | — | 35 | % | (15) | % | — | — | ||||
| Adjusted EBITDA (2) | 14,315 | 16,332 | (2,017 | ) | (12) | % | 54,661 | 43,558 | 11,103 | 25 | % | |||||
| Adjusted EBITDA margin (2) | 25 | % | 35 | % | — | — | 28 | % | 30 | % | — | — | ||||
| 1 | Gross margin and Operating margin are supplemental financial ratios; refer to Section 10 - Non-IFRS and Other Financial Measures and Ratios of the Company's MD&A. |
| 2 | Gross Mining profit, Gross Mining margin, EBITDA, EBITDA margin, Adjusted EBITDA and Adjusted EBITDA margin are non-IFRS measures or ratios; refer to Section 10 - Non-IFRS and Other Financial Measures and Ratios of the Company's MD&A. |
Reconciliation of Consolidated Net Income (loss) to EBITDA and Adjusted EBITDA | ||||||||||||||||
| Three months ended | Year ended | |||||||||||||||
| (U.S.$ in thousands except where indicated) | 2024 | 2023 | $ Change | % Change | 2024 | 2023 | $ Change | % Change | ||||||||
| Revenues | 56,163 | 46,241 | 9,922 | 21 | % | 192,881 | 146,366 | 46,515 | 32 | % | ||||||
| Net (loss) income before income taxes | 5,458 | (62,423 | ) | 67,881 | nm | (68,353 | ) | (109,323 | ) | 40,970 | (37) | % | ||||
| Interest (income) and expense | (290 | ) | 91 | (381 | ) | (419) | % | (4,299 | ) | 2,659 | (6,958 | ) | (262) | % | ||
| Depreciation and amortization | 24,584 | 21,790 | 2,794 | 13 | % | 149,727 | 84,785 | 64,942 | 77 | % | ||||||
| Sales tax recovery - depreciation and amortization | — | — | — | — | % | (8,760 | ) | — | (8,760 | ) | 100 | % | ||||
| EBITDA | 29,752 | (40,542 | ) | 70,294 | nm | 68,315 | (21,879 | ) | 90,194 | nm | ||||||
| EBITDA margin | 53 | % | (88) | % | — | — | 35 | % | (15) | % | — | nm | ||||
| Share-based payment | 4,021 | 3,906 | 115 | 3 | % | 13,949 | 10,915 | 3,034 | 28 | % | ||||||
| Impairment on short-term prepaid deposits, property, plant and equipment and assets held for sale | — | 2,270 | (2,270 | ) | 100 | % | 3,628 | 12,252 | (8,624 | ) | (70) | % | ||||
| Reversal of revaluation loss on digital assets | — | (1,183 | ) | 1,183 | 100 | % | — | (2,695 | ) | 2,695 | 100 | % | ||||
| Gain on extinguishment of long-term debt and lease liabilities | — | — | — | — | % | — | (12,835 | ) | 12,835 | 100 | % | |||||
| (Gain) loss revaluation of warrants | (6,314 | ) | 42,760 | (49,074 | ) | (115) | % | (19,603 | ) | 42,974 | (62,577 | ) | (146) | % | ||
| Gain on disposition of marketable securities | (782 | ) | (999 | ) | 217 | (22) | % | (2,313 | ) | (12,245 | ) | 9,932 | (81) | % | ||
| Service fees not associated with ongoing operations | 1,287 | — | 1,287 | 100 | % | 13,766 | — | 13,766 | 100 | % | ||||||
| Sales tax recovery - prior years - energy and infrastructure and G&A expenses (1) | — | 2,485 | (2,485 | ) | 100 | % | (16,081 | ) | 9,281 | (25,362 | ) | (273) | % | |||
| Net financial (income) expense and other | (13,649 | ) | 7,635 | (21,284 | ) | (279) | % | (7,000 | ) | 17,790 | (24,790 | ) | (139) | % | ||
| Adjusted EBITDA | 14,315 | 16,332 | (2,017 | ) | (12) | % | 54,661 | 43,558 | 11,103 | 25 | % | |||||
| Adjusted EBITDA margin | 25 | % | 35 | % | — | — | 28 | % | 30 | % | — | — | ||||
nm: not meaningful
| 1 | Sales tax recovery relating to energy and infrastructure and general and administrative expenses have been allocated to their respective periods; refer to Note 29b - Additional Details to the Statement of Profit or Loss and Comprehensive Profit or Loss (Canadian sales tax refund) to the Financial Statements. |
Calculation of Gross Mining Profit and Gross | ||||||||||||||||
| Three months ended | Year ended | |||||||||||||||
| (U.S.$ in thousands except where indicated) | 2024 | 2023 | $ Change | % Change | 2024 | 2023 | $ Change | % Change | ||||||||
| Gross (loss) profit | 1,387 | 1,757 | (370 | ) | (21) % | (32,359 | ) | (21,502 | ) | (10,857 | ) | 50 | % | |||
| Non-Mining revenues¹ | (1,592 | ) | (1,285 | ) | (307 | ) | 24 | % | (5,102 | ) | (5,060 | ) | (42 | ) | 1 | % |
| Depreciation and amortization | 24,584 | 21,790 | 2,794 | 13 | % | 149,727 | 84,785 | 64,942 | 77 | % | ||||||
| Sales tax recovery - depreciation and amortization | — | — | — | — | % | (8,760 | ) | — | (8,760 | ) | (100) | |||||
| Electrical components and salaries | 1,403 | 1,095 | 308 | 28 | % | 4,081 | 4,151 | (70 | ) | (2) | % | |||||
| Sales tax recovery - prior years - energy and infrastructure² | — | 2,211 | (2,211 | ) | 100 | % | (14,338 | ) | 8,366 | (22,704 | ) | (271) | % | |||
| Other | 4 | (114 | ) | 118 | nm | 1,220 | (463 | ) | 1,683 | nm | ||||||
| Gross Mining profit | 25,786 | 25,454 | 332 | 1 | % | 94,469 | 70,277 | 24,192 | 34 | % | ||||||
| Gross Mining margin | 47 | % | 57 | % | — | — | 50 | % | 50 | % | — | — | ||||
nm: not meaningful
| (1 | ) | Non-Mining revenues reconciliation: |
| Three months ended | Year ended | |||||||||||||||
| (U.S.$ in thousands except where indicated) | 2024 | 2023 | $ Change | % Change | 2024 | 2023 | $ Change | % Change | ||||||||
| Revenues | 56,163 | 46,241 | 9,922 | 21 | % | 192,881 | 146,366 | 46,515 | 32 | % | ||||||
| Less Mining related revenues for the purpose of calculating gross Mining margin: | ||||||||||||||||
| Mining revenues³ | (54,571 | ) | (44,956 | ) | (9,615 | ) | 21 | % | (187,779 | ) | (141,306 | ) | (46,473 | ) | 33 | % |
| Non-Mining revenues | 1,592 | 1,285 | 307 | 24 | % | 5,102 | 5,060 | 42 | 1 | % | ||||||
| (2 | ) | Sales tax recovery relating to energy and infrastructure expenses has been allocated to their respective periods; refer to Note 29b - Additional Details to the Statement of Profit or Loss and Comprehensive Profit or Loss (Canadian sales tax refund) to the Financial Statements. |
| (3 | ) | Mining revenues include revenues from sale of computational power used for hashing calculations and revenues from computational power sold in exchange of services. |
Calculation of Direct Cost and Direct Cost per BTC | ||||||||||||||||
| Three months ended | Year ended | |||||||||||||||
| (U.S.$ in thousands except where indicated) | 2024 | 2023 | $ Change | % Change | 2024 | 2023 | $ Change | % Change | ||||||||
| Cost of revenues | 54,776 | 44,484 | 10,292 | 23 | % | 225,240 | 167,868 | 57,372 | 34 | % | ||||||
| Depreciation and amortization | (24,584 | ) | (21,790 | ) | (2,794 | ) | 13 | % | (149,727 | ) | (84,785 | ) | (64,942 | ) | 77 | % |
| Sales tax recovery - depreciation and amortization | — | — | — | — | % | 8,760 | — | 8,760 | 100 | % | ||||||
| Electrical components and salaries | (1,403 | ) | (1,091 | ) | (312 | ) | 29 | % | (4,081 | ) | (4,141 | ) | 60 | (1) | % | |
| Infrastructure | (1,456 | ) | (1,607 | ) | 151 | (9) | % | (5,784 | ) | (3,909 | ) | (1,875 | ) | 48 | % | |
| Sales tax recovery - prior years - energy and infrastructure (1) | — | (2,211 | ) | 2,211 | 100 | % | 14,338 | (8,366 | ) | 22,704 | 271 | % | ||||
| Other | (649 | ) | — | (649 | ) | (100) | % | — | 82 | (82 | ) | (100) | % | |||
| Direct Cost | 26,684 | 17,785 | 8,899 | 50 | % | 88,746 | 66,749 | 21,997 | 33 | % | ||||||
| Quantity of BTC earned | 654 | 1,236 | (582 | ) | (47) | % | 2,914 | 4,928 | (2,014 | ) | (41) | % | ||||
| Direct Cost per BTC (in | 40,800 | 14,400 | 26,400 | 183 | % | 30,500 | 13,500 | 17,000 | 126 | % | ||||||
nm: not meaningful
Calculation of Total Cash Cost and Total Cost per BTC | ||||||||||||||||
| Three months ended | Year ended | |||||||||||||||
| (U.S.$ in thousands except where indicated) | 2024 | 2023 | $ Change | % Change | 2024 | 2023 | $ Change | % Change | ||||||||
| Cost of revenues | 54,776 | 44,484 | 10,292 | 23 | % | 225,240 | 167,868 | 57,372 | 34 | % | ||||||
| General and administrative expenses | 18,042 | 13,405 | 4,637 | 35 | % | 71,240 | 39,292 | 31,948 | 81 | % | ||||||
| 72,818 | 57,889 | 14,929 | 26 | % | 296,480 | 207,160 | 89,320 | 43 | % | |||||||
| Depreciation and amortization | (24,584 | ) | (21,790 | ) | (2,794 | ) | 13 | % | (149,727 | ) | (84,785 | ) | (64,942 | ) | 77 | % |
| Non-cash service expense (2) | (688 | ) | — | (688 | ) | (100) | % | (1,252 | ) | — | (1,252 | ) | (100) | % | ||
| Sales tax recovery - depreciation and amortization | — | — | — | — | % | 8,760 | — | 8,760 | 100 | % | ||||||
| Electrical components and salaries | (1,403 | ) | (1,091 | ) | (312 | ) | 29 | % | (4,081 | ) | (4,141 | ) | 60 | (1) | % | |
| Share-based payment | (4,021 | ) | (3,906 | ) | (115 | ) | 3 | % | (13,949 | ) | (10,915 | ) | (3,034 | ) | 28 | % |
| Service fees not associated with ongoing operations | (1,287 | ) | — | (1,287 | ) | (100) | % | (13,766 | ) | — | (13,766 | ) | (100) | % | ||
| Sales tax recovery - prior years - energy and infrastructure and G&A expenses (1) | — | (2,485 | ) | 2,485 | 100 | % | 16,081 | (9,281 | ) | 25,362 | 273 | % | ||||
| Other | (1,078 | ) | 201 | (1,279 | ) | (636) | % | (5,659 | ) | 890 | (6,549 | ) | (736) | % | ||
| Total Cash Cost | 39,757 | 28,818 | 10,939 | 38 | % | 132,887 | 98,928 | 33,959 | 34 | % | ||||||
| Quantity of BTC earned | 654 | 1,236 | (582 | ) | (47) | % | 2,914 | 4,928 | (2,014 | ) | (41) | % | ||||
| Total Cash Cost per BTC (in | 60,800 | 23,300 | 37,500 | 161 | % | 45,600 | 20,100 | 25,500 | 127 | % | ||||||
nm: not meaningful
| 1 | Sales tax recovery relating to energy and infrastructure and general and administrative expenses have been allocated to their respective periods; refer to Note 29b - Additional Details to the Statement of Profit or Loss and Comprehensive Profit or Loss (Canadian sales tax refund) to the Financial Statements. |
| 2 | Non-cash service expense, included in infrastructure, which was exchanged for computational power sold. |
A photo accompanying this announcement is available at https://www.globenewswire.com/NewsRoom/AttachmentNg/d24a5e36-6201-4d4f-a4f9-8fdc9aaeb95b

![]()
Anticipated Megawatt Growth

Bitfarms’ clear path to 1.4+ GW of power capacity and strategic rebalancing of portfolio towards North America
Source: Bitfarms Ltd.